
In the last few years, I’ve been working on building and refactoring the online reporting systems to handle increasing amounts of data and user traffic. Throughout the process, there are many lessons learned and many to be learned. This is the first of a series of posts on my experiences in the online reporting and analytics domain.
(coming next) Create or improve on existing data pipeline with an example case study
(coming next) Scale with performance – performance improvement tips
(coming next) AI workflow with reporting data
This article will cover mostly user-facing ‘real-time’ analytical systems or OLAP (online analytical platform).
Design for the users and work with the users
Data, as technical as it goes, eventually is meaningless when it can not be consumed efficiently and represented in a user-friendly manner. So, like anything else in software engineering, we should always put users in the centre of the stage. One common mistake I experienced was building the project around some new technology and then figuring out the user interactions at a later time.
From a customer/user standpoint, here are a few things to consider:
- interactions allowed around data
I consider this the top priority among all. For two OLAP systems, targeting two groups of users with two sets of requirements, the functions we are to provide can vary hugely. There are tradeoffs between functionalities and engineering effort. For the longevity of the system, ideally, we should always start with the most valuable for the users and deliver incremental changes. - response time
A response time can be determined from the users’ submit the request to the report fully rendered. Usually, this involves multiple services and data stores. For a user-facing reporting system, people’s expectation is determined by the functionality, requested data size, filters, merging and stitching of the data. We usually need to create a profile of the reporting system performance by running performance tests with near real-world traffic. We can then find out the response time curve over data size, selected dimension and other properties.
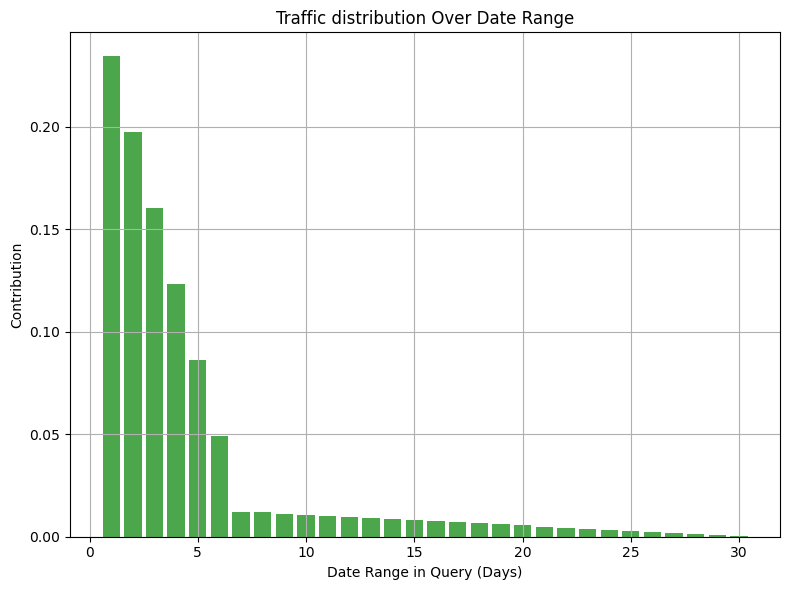
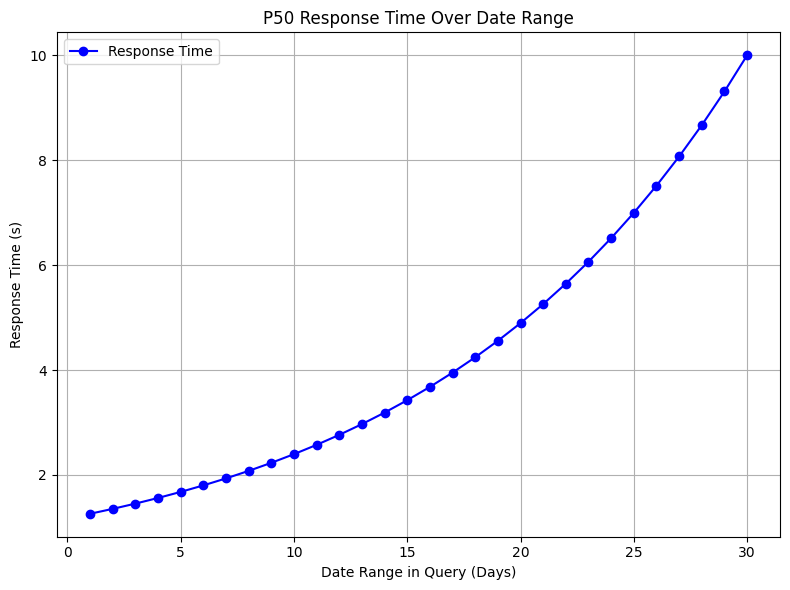
Assuming the above a P50 over date range in the selection chart after we have a few rounds of performance test runs. We then need to establish a baseline performance covering most of the requests. This helps us to set monitoring alerts and create SLA for our reporting stack (although the baseline does not cover all requests and use cases).
For the reporting systems, P95 or even P99 latency plays a big role not only for the UX but for the system’s overall performance too. This is the ‘long tail’ effect taking place. To support these over the baseline requirements, we usually need to consider designated workflow or infra. Being someone designing the system, we need to make the call on where to draw the line so the vast majority of use cases can be satisfied while the outliers can be supported separately, sometimes with a reduced but still acceptable UX.
- data freshness
Depending on the data ingestion model (event-driven, ETL, zero-ETL, batched incremental update, etc), generally the data freshness is the time between when a new data is generated and when it is query-able on the processing nodes.
There are several types of ‘new data’: 1) appended events 2) modification on newer and historical entries 3) downstream data frames update 4) structural change on the target data frame.
1. Appended events freshness is the result of the most common type of data ingestion. It can be new events on newer data partitions or older data partitions. Often, the analytics systems are built over a time series of events and we keep only the most recent data partitions in memory for faster access. These are hot partitions. Older partitions are kept on disc. The cost of updating data in memory VS on disc can have significant differences. Additionally, some data storage formats do not allow incremental updates or it’s costly (like parquet). These are things we need to consider while deciding the destination of persistent and ephemeral data stores.
2. Modification of data is tricky. Ideally, it should never happen. However, in the real world, most likely we are dealing with legacy systems to some extent. It is slightly simpler when the modification is purely done to the in-memory part of the data. We can then quickly locate the old data, if indexed efficiently, tombstone it, and append the new data. As simple as it sounds, there are many edge cases and exceptions to be handled. Modification of ‘older’ data can cause many side effects, due to the nature of on-disc storage, locating the old entries is not going to be easy. Some might maintain a standalone storage which is designed to be fast at indexing access to reference the location of these entries. Once this update is done, rewriting the files to disc will produce additional latency.
3. Some OLAP systems have a concept of downstream views, saved views or materialised views. (full-text search engines like OpenSearch do not have it) Latency will occur when these downstream data frames need updating. This sometimes can be a stop-the-world operation for the node. It sometimes can be very expensive and technically complicated to keep the downstream up-to-date.
4. Changing data structures has to be carefully done. Many types of latency can also add to this tricky operation. Utilising these changes and being backwards compatible is the key when we want to do a staged rollout which is essential. In an ideal world, we only add data decisions, no modifications or deletions.
We need to consider the event structure update (if in an event-driven system), historical data backfill, and downstream data update when data is ready on the root. These are all freshness latency added to the ETL and streaming process.
And again, in a memory VS disc scenario, it adds more complexity and latency. - system reliability
We all want our systems to be 100% up all the time. This is not possible. At the start of the designing phase, we need to be deeply involved with business and product and establish service level agreements.
On top of that, we need to account for the maintenance windows and unexpected provider downtimes. Communicate with users ahead of time so we can manage their expectations. - cost
OLAP is one of the most costly parts of a company’s IT system. Resource budgeting is a general practice while launching a product, especially when it is customer-facing. The added cost of running the system must make justifications based on the added value.
From an engineering standpoint, the cost of OLAP consists of (roughly) the following: data ingestion, pre-computation and ETL, computation, data store and access, redundancy, COGS cost for running on staging and dev environments, and most importantly, engineering cost.
The Team owning the data pipeline and OLAP should definitely have the visibility to their own cost of the system. - future proof
Creating a system that can grow from 1x to 100x is as hard as creating a system from 0 to 1, if not harder. Being future-proof doesn’t only mean handling more traffic but also making it available to handle more sources of data and more shapes of data.
This requires us to start from the data, to have a customer-centric mindset with a deep understanding of the business. - development velocity
For what it is worth, development velocity trumps many of the points above. We want fast iterations. We want to test the market and users’ reactions with faster releases. Often, when given the task of ‘building an OLAP’ to solely engineering teams, people focus more on the ability to scale rather than the time to deliver. This unfortunately happened to me multiple times and I have learned it the hard way.
So, choose the OLAP technology wisely. Do more rounds of tests with different data queries before coming to the decision-making. - on promise VS hosted VS cloud maintained
This can be a subpoint of developer velocity or cost because having everything in-house is cheaper to build apps on but more costly to set up and maintain. There are always tradeoffs and not all of us would have the luxury to choose – like myself, I couldn’t since wherever I go everything is on the same cloud provider.